IXTpolygons
Revision as of 10:43, 22 October 2009 by Dean Whittaker (talk | contribs)
IXTpolygons objects exists only in matlab and are used to store a series of shapes (with related signal values). This is useful for irregular grids (such as those used in mslice). The elements in an IXTpolygons object are:
| Field | Type | Description |
|---|---|---|
| title | char | Title of the dataset used in plotting |
| signal | n x 1 matrix | Signal data, this will be a single column, the length of the number of shapes that are in the object. |
| error | n x 1 matrix | Standard error, this will be a single column, the length of the number rof shapes that are in the object. |
| s_axis | IXTaxis | object containing the signal axis label and units code information |
| Vertices | m x 2 matrix | A list of (x,y) points that will be used to construct the shapes |
| Faces | n x p matrix | Contains a list of shapes, each row is a list of numbers corresponding to the rows in the vertices field. The points that these indexes correspond to will be connected to make the required shape. There are as many rows as shapes in the object. |
| x_axis | IXTaxis | object containing the x axis label and units code information |
| x_distribution | logical | True if signal is a distribution on x (e.g. counts/microsecond) False if signal is not a distribution on x (e.g. counts) |
| y_axis | IXTaxis | object containing the y axis label and units code information |
| y_distribution | logical | True if signal is a distribution on y (e.g. counts/spectrum) False if signal is not a distribution on y (e.g. counts) |
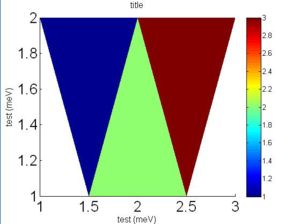
The following command
test = IXTpolygons('title',[1; 2; 3], [0; 0; 0], axisdummy, [1,2; 1.5,1; 2,2; 2.5,1; 3,2],[1,2,3;2,3,4;3,4,5],axisdummy, true, axisdummy, true)
da(test)
produces the folling plot
Currently only the da plot command works, the same commands (such as lx) can be used after the object has been plotted.
